Oregon Tilth believes healthy economies spur real change. And we think well-informed consumer choice in the market can provide incentives for best practices and good stewardship.
How does data apply to the organic sector? What can carefully collected numbers tell us about our food future? As a data technology executive once explained, “The goal is to turn data into information, and information into insight.”
One of Oregon Tilth’s areas of focus is expanding public and private investment in sustainable food-system efforts. We want to persuade government agencies, public universities and the private sector to dedicate limited resources in support of organic agriculture. Our success depends on our ability to demonstrate the potential return on that investment. In other words, making a strong case in support of sustainable agriculture requires solid numbers from a trusted source.
Thanks to efforts by Oregon Tilth and our advocacy partners, the 2014 Farm Bill included $5 million to fund data collection on organic agriculture that will give policy makers, organic farmers and organic businesses data needed to make sound policy, business, growing and marketing decisions.
2014 Organic Production Survey
In September 2015, the U.S. Department of Agriculture’s (USDA) National Agricultural Statistics Service (NASS) released the 2014 Organic Survey. This is the third organic production and practices survey NASS has conducted on the national level since 2008.
The 2014 Organic Survey provides valuable, detailed, objective information to help determine the economic impact of organic production at the national and state levels. Data published from the Survey will help provide the organic sector with a timely, reliable source of information.
The agricultural sector and all levels of government can use the information to prepare a variety of organic agricultural-related programs, economic models, legislative initiatives and market analysis and feasibility studies. These programs directly affect the life and communities of farmers and help to improve agriculture production technologies and practices.
The story behind the numbers
On its own, data can’t tell us very much. Numbers have an important story to tell, but they rely on careful analysis and interpretation to give them a voice.
The 2014 Organic Survey showed how organic farms use a variety of production practices that protect public health and conserve natural resource. Sixty-six percent of all organic farms reported maintaining buffer strips or border rows to isolate organic products from non-organic land where chemical applications occur. Just over half reported using water-management practices, such as irrigation scheduling and controlled drainage. Forty-one percent reported using no-till or minimum-till cropping to improve soil health. And just over a third increased biodiversity by providing habitat for beneficial insects or vertebrates to manage pests or disease.
With regard to marketing channels, NASS Administrator Joseph T. Reilly said, “The report shows that organic producers are providing a wide variety of products to customers and are getting those items from farm to table more efficiently.”
The vast majority of organic agricultural products sold in 2014 were sold close to the farm. According to the report, the first point of sale for 80 percent of all U.S. organic products was less than 500 miles from the farm, compared to 74 percent in 2008. Of the sales of organic products in 2014:
- 46 percent sold in 100 miles
- 34 percent sold in 101-499 miles
- 18 percent sold in 500 or more miles
- 2 percent sold internationally
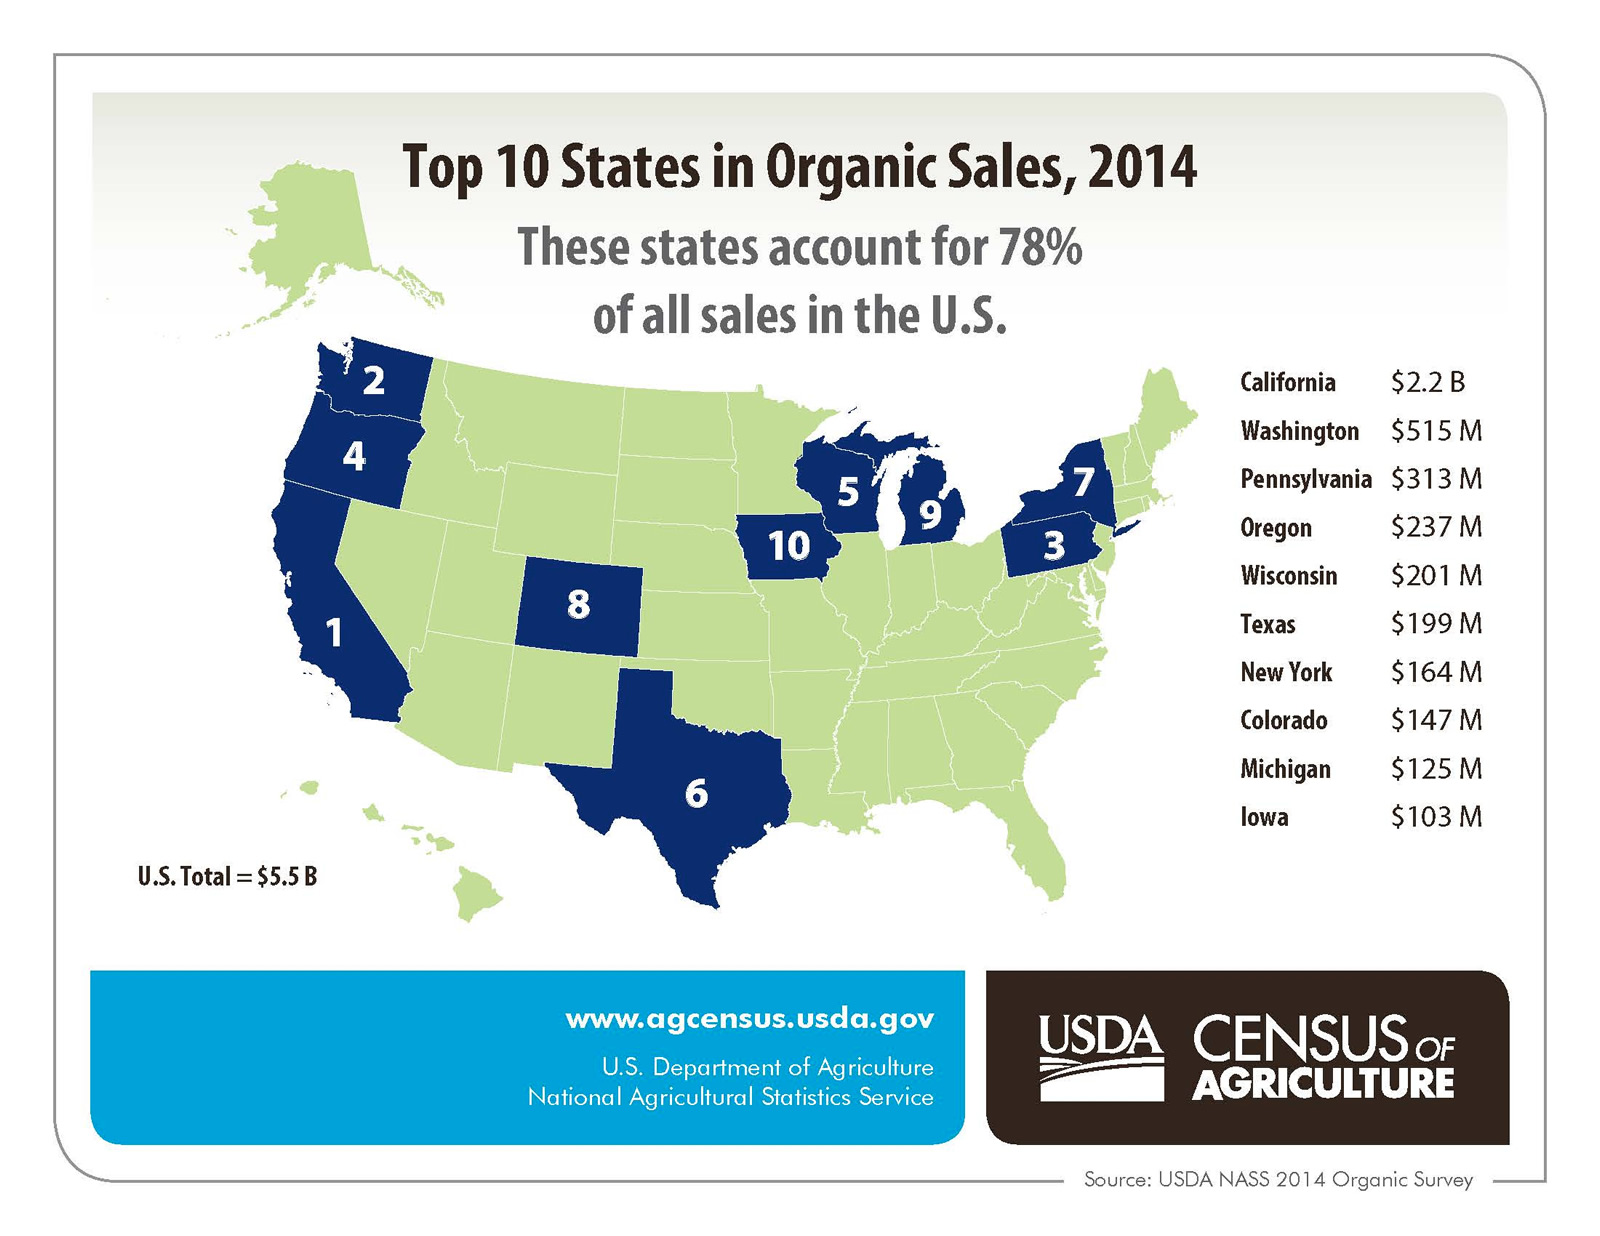
The survey showed that sales of organic crops and livestock at the farm-gate level reached $5.5 billion in 2014, up 72 percent from 2008. It also shows potential for continued growth, with 39 percent of organic farmers surveyed reporting that they intend to increase production over the next five years.
And while these numbers support a positive story filled with opportunity for an organic-food future, other aspects of the survey raise important questions. As U.S. organic farms saw increased sales and overall economic value, the total number of organic farms and organic acreage actually decreased from 2008 to 2014. Is this decrease specific to a particular region or perhaps specific crops or livestock? Did farm size play a factor? Asking good questions will be an important part of further data analysis to better understand the challenges and barriers to growth.

Tip of the data iceberg
Starting in 2008, there have been three publicly funded national surveys that provide some much-needed data. However, it’s only a few dots on a much longer trend line. Our understanding of organic agriculture will deepen with the more data we collect and the longer we collect that data. This will give organic advocates the tools they need to share success stories, lessons learned, and the opportunities and challenges ahead.
With a collaborative spirit to support our efforts, Oregon Tilth has helped pave the way for greater cooperation in support of organic agriculture. We’ve successfully cultivated strategic partnerships with public institutions like extension services and government agencies. Having good data from reliable sources has been a key to creating these partnerships.
As Stanford University data analyst Atul Butte said, “Hiding within those mounds of data is knowledge that could change the world.”


